What Do Similarities & Differences in DNA Teach Us?
We can also learn about evolution by examining the similarities or differences in DNA between species and as a result, we can see which genes remain the same and which change over time. Comparing DNA tells us about the evolution of our species. As life forms evolve, their DNA changes. Mutations, which occur when DNA replicates, cause these changes. A similarity can suggest a close relationship between two organisms, and can also tell us if two organisms share a common ancestor.
Finally, you and your pup share more than just genetics. Your environments are also very similar! You sleep in the same house—maybe even the same bed!—go on walks together, and breathe the same air. Interactions between these environmental variables and your genetics (called gene by environment interactions) can have an important impact on health. For example, smoking is well known to increase risk of bladder cancer in humans[3], but it is still unknown how secondhand smoke affects risk of bladder cancer in dogs.[4]
[/vc_column_text][/vc_column][vc_column width=”1/2″][vc_single_ =”1604″ img_size=”250×250″ add_caption=”yes” alignment=”center” style=”vc_box_circle_2″ css=”.vc_custom_1629295138709{margin-bottom: 0px !important;border-bottom-width: 0px !important;padding-bottom: 10px !important;}”][vc_column_text css=”.vc_custom_1610655101716{margin-top: 0px !important;border-top-width: 0px !important;padding-top: 0px !important;}”]
[vc_column width=”1/2″][vc_single_ =”1575″ img_size=”250×250″ add_caption=”yes” alignment=”center” style=”vc_box_circle_2″ css=”.vc_custom_1629295146525{margin-bottom: 0px !important;border-bottom-width: 0px !important;padding-bottom: 10px !important;}”][vc_column_text css=”.vc_custom_1610655101716{margin-top: 0px !important;border-top-width: 0px !important;padding-top: 0px !important;}”]
Did you know that dogs and people share over 17,000 special genes called orthologs? Each pair of orthologs is derived from the same common ancestor via vertical descent (speciation) and they tend to have similar functions. They are one of the main reasons why your pup is such an invaluable comparative animal model for studying human health. In fact, humans and dogs have numerous similarities even in those parts of the genome that aren’t genes (the noncoding part of the genome). When it comes to better understanding human health, your pup is our best friend!
 Your pup may be your “fur baby,” but how similar are you genetically? You may be surprised!
Genetics and the Shape of Dogs
Studying the new sequence of the canine genome shows how tiny genetic changes can create enormous variation within a single species
A pekingese weighs only a couple of pounds; a St. Bernard can weigh over 180. Both dogs, though vastly different in appearance, are members of the same genus and species, Canis familiaris. How dog breeds can exhibit such an enormous level of variation between breeds, and yet show strong conformity within a breed, is a question of interest to breeders and everyday dog lovers alike. In the past few years, it has also become a compelling question for mammalian geneticists.
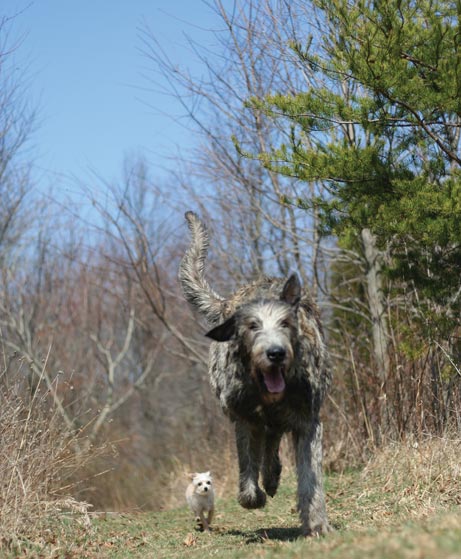
Figure 1. These playful companions—a chihuahua–toy poodle mix and a Scottish deerhound—are both representatives of the species Canis familiaris. How a single species can exhibit such immense variation in size and other attributes has become a compelling question for mammalian geneticists. Recent sequencing of the dog genome has provided new insights into what a dog breed really is and has contributed to new techniques for mapping genes controlling body shape and size.
Photograph courtesy of Tyrone Spady and the author. Ad Right
The “dog genome project” was launched in the early 1990s, motivated by scientists desire to find the genes that contributed to many of the ills suffered by purebred dogs. Most dog breeds have only been in existence for a few hundred years. Many exhibit limited genetic diversity, as dog breeds are typically descended from a small number of founders, created by crossing closely related individuals. Further, breeds often experience population bottlenecks as the popularity of the breed waxes and wanes. As a result of this population structure, genetic diseases are more common in purebred dogs than in mixed-breed dogs. Scientists have been motivated to use dog populations to find genes for diseases that affect both humans and dogs, including cancer, deafness, epilepsy, diabetes, cataracts and heart disease. In doing so we can simultaneously help man and mans best friend.
The initial stages of the dog genome project involved the building of maps that allowed scientists to navigate the dog genome. Quick to follow were the production of resources that facilitated the manipulation of large pieces of dog genome DNA and a numbering of the dogs 38 pairs of autosomes (non-sex chromosomes) as well as the X and Y chromosomes. Finally, in 2003, a partial sequence of a standard poodle was produced that spanned nearly 80 percent of the 2.8 billion base pairs that make up the dog genome. This was followed quickly by a concerted effort to fully sequence the boxer genome, producing what is today the reference sequence for the dog.
How is this information being used by geneticists today? The availability of a high-quality draft sequence of the dog genome has quite literally changed the way geneticists do their work. Previously scientists used so-called “candidate gene” approaches to try and guess which genes were responsible for a particular disease or trait of interest. By knowing something about what a gene does or what family it belongs too, we can sometimes, but not always, develop excellent hypotheses as to what happens when a specific gene goes awry. However, candidate gene approaches are often characterized by frustration and great expense. Hence, companion-animal geneticists are turning increasingly to the more sophisticated genomic approaches made possible by the success of the dog genome project.
Central to our ability to use the newly available resources is an understanding of breed structure, the strengths and limitations of the current molecular resources, and consideration of the traits which are likely to lend themselves to mapping using available resources. In this article I highlight first our current understanding of what a dog breed really is and summarize the status of the canine genome sequencing project. I review some early work made possible by this project: studies of the Portuguese water dog, which have been critical to our understanding of how to map genes controlling body shape and size, along with studies aimed at understanding the genetics of muscle mass.
The domestic dog is believed to be the most recently evolved species from the family Canidae. Within the Canidae there are three distinct phylogenetic groups, or clades; the domestic dog shares a clade with the wolflike canids such as the gray wolf, coyote and jackals. Dogs are thought to have arisen perhaps as recently as 40,000 years ago, with initial domestication events occurring in eastern Asia. Most domestic breeds that we recognize today, however, likely are the product of human breeding over the last 200-300 years. Many of the most common modern breeds were developed in Europe in the 1800s. Some of the breeds represented in antiquity, including the greyhound and the pharaoh hound, are particularly interesting to study, as it is unclear whether dogs from these breeds are re-creations of ancient breeds or whether dogs alive today can truly trace their lineage to founders from thousands of years ago.
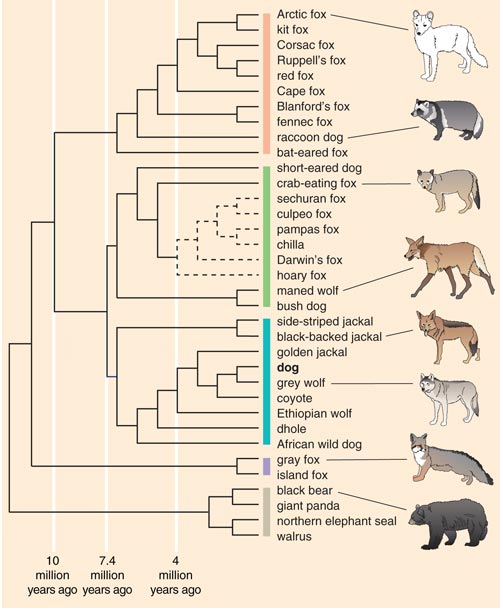
Figure 2. Canid species can be divided into four phylogenetic groups based on a comparison of genetic sequences: red fox–like (peach bar), South American (green bar), wolflike (blue bar) and gray and island fox species (purple bar). Inferred evolutionary relationships are also shown for related taxa that diverged from the canids more than 10 million years ago (gray bar). The domestic dog, which belongs to the wolflike clade, is believed to be the most recently evolved species in the family Canidae. Estimated divergence times in the past are shown for three nodes along the tree. Dashed lines indicate classifications with less statistical certainty.
Adapted by Barbara Aulicino and Linda Huff from Lindblad-Toh et al. 2005.
The American Kennel Club (AKC) currently recognizes about 155 breeds of dog, but new breeds are created and given breed-recognition status frequently. What defines a dog breed? Although a dogs parentage can be recognized by its physical attributes—coat color, body shape and size, leg length and head shape, among others—the concept of a breed has been formally defined by both dog fanciers and geneticists.
Dog regulatory bodies such as the AKC define an individuals breed by its parentage. For a dog to become a registered member of a breed (say, a golden retriever), both of its parents must have been registered members of the same breed, and their parents in turn must be registered golden retrievers. As a result, dog breeds in the United States today are generally closed breeding populations with little opportunity for introduction of new alleles (variations in the genome). At a genomic level, purebred dogs are usually characterized by reduced levels of genetic heterogeneity compared to mixed-breed dogs. Breeds that derive from small numbers of founders, have experienced population bottlenecks or have experienced popular-sire effects—that is, the effect on the breed of a dog who does well in shows producing a disproportionate number of litters—display further reductions in genetic heterogeneity.
Recently, my laboratory group and others have begun to use genetic tools such as markers to define the concept of a dog breed. A genetic marker is a position in the genome where there is variability in the sequence that is inherited in a Mendelian fashion (that is, following the rules of classical genetics). Two common kinds of markers are microsatellite markers, where the variation comes from the number of times a repeat element is reiterated at a given position on a chromosome, and single-nucleotide polymorphisms (SNPs, pronounced “snips”), in which the DNA sequence varies when a single nucleotide (denoted A, C, T or G) in a sequence differs between the paired chromosomes of an individual.
These alterations are proving invaluable for understanding the role of genetic modifications both within and between breeds. Because the alleles of markers are inherited from parent to child in a Mendelian fashion, they can be used to track the inheritance of adjacent pieces of DNA through the multiple generations in a family. There are thousands of microsatellite markers and millions of SNPs distributed randomly throughout the canine genome.
In order to determine the degree to which dogs could be assigned correctly to their breed group, my lab utilized data from 96 microsatellite markers spanning all the dogs 38 autosomes in a set of 414 dogs representing 85 breeds. We found, first, that nearly all individual dogs were assigned correctly into their breed group when we used a set of statistical tools called clustering algorithms, which look for similarities in the frequency and distribution of alleles between individuals. The exceptions largely included six sets of closely related breed pairs (for example whippet-greyhound and mastiff-bullmastiff) that could only be assigned to their respective breeds when considered in isolation from other breeds.
We also showed that the genetic variation between dog breeds is much greater than the variation within breeds. Between-breed variation is estimated at 27.5 percent. By comparison, genetic variation between human populations is only 5.4 percent. Thus the concept of a dog breed is very real and can be defined not only by the dogs appearance but genetically as well.
A second part of the study used an assignment test to determine whether we could correctly identify each dogs breed by its genetic profile alone. In a blinded study, where the computer program did not know what data set came from which breed, 99 percent of dogs were correctly assigned to their breed based on their DNA profile alone.
To determine the ancestral relationship between breeds, Heidi Parker from my lab used data from the same set of dogs and sought to determine, ideally, which dog breeds were most closely related to one another. To do this we utilized a computer program called structure, which was developed by Jonathan Pritchard at the University of Chicago and his colleagues. The program identifies genetically distinct subpopulations within a group based on patterns of allele frequencies, presumably from a shared ancestral pool.
The structure analysis initially ordered the 85 breeds into four clusters, generating a new canine classification system. Cluster 1 comprised dogs of Asian and African origin—thought to be older lineages—as well as gray wolves. Cluster 2 included largely mastiff-type dogs with big, boxy heads and large, sturdy bodies. The third and fourth clusters split a group of herding dogs and sight hounds away from the general population of modern hunting dogs, the latter of which includes terriers, hounds and gun dogs. As more dog breeds have been added to the study, additional groupings have emerged.
These data are extremely useful for disease-gene mapping studies. In some cases, dogs from breeds that are members of the same cluster can be analyzed simultaneously to increase the statistical power of the study. This will not only aid in the identification of genomic regions in which the disease gene lies, but will also assist in “fine mapping” studies which aim to reduce the region of DNA linkage to a manageable size of about 1 million bases. Once a region is well defined, we can begin to select candidate genes for mutation testing.
The first published sequence of the dog genome was completed in 2003 in an effort lead by Ewen Kirkness at The Institute for Genome Research. Genomes are typically sequenced in many thousands of overlapping segments, and to ensure that the whole genome is recorded at least once, it is estimated that there have to be seven or eight iterations, or “reads,” across the entire genome. The 2003 genome, from a standard poodle, was a so-called survey sequence. The genome was sequenced just 1.5 times, so about 80 percent of the genome was present in the final data set. This work was followed shortly thereafter by the release of the draft assembly of the boxer genome, led by Kerstin Lindblad-Toh and colleagues at the Broad Institute, which was done at 7.5x density. With millions of reads successfully completed, nearly 99 percent of the genome is present in the final data set.
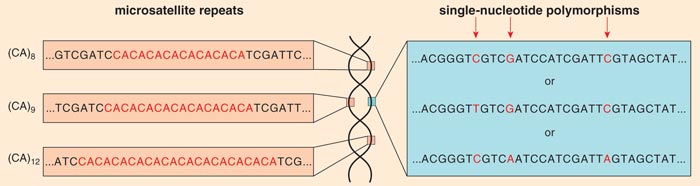
Figure 3. Molecular markers locate variation in the genome that can be used in the search for genes responsible for traits. In the case of dogs, they have been used to define the concept of a breed. Markers useful for tracing the inheritance of chromosomal segments of DNA include microsatellite repeats (left) and single-nucleotide polymorphisms (right). A microsatellite repeat might be a simple pair of nucleotides (denoted here by letters); CA repeat–based markers are very common. In this example the dinucleotide repeat is reiterated 8, 9 and 13 times at different positions in the genome. A single-nucleotide polymorphism (or SNP, pronounced “snip”) occurs when the same stretch of DNA varies from one copy of a chromosome to another by a single nucleotide.
Barbara Aulicino
Both resources have proved to be extremely useful. The 1.5x sequence provided the first glimpse into the organization of the dog genome, number of genes and organization of repeat elements. One surprise was the discovery of a large number of short interspersed nuclear elements (SINEs) littered throughout the dog genome that were occasionally located at positions with the potential to affect gene expression. For example, the insertion of a SINE element into the gene encoding the hypocretin receptor, a neuropeptide hormone found in the hypothalamus of the brain, results in the disease narcolepsy in the Doberman pinscher. Similarly, a SINE element inserted into the SILV gene (known to be related to pigmentation) is responsible for merle, the mottled patterning of a dogs coat.
The 7.5x female boxer sequence spans most of the dogs 2.4 billion bases in a sum total of 31.5 million sequence reads. The sequence is estimated to cover over 99 percent of the eukaryotic genome and provides data for the existence of about 19,000 genes. For about 75 percent of the genes, the homology (amount of similarity arising from shared ancestry) between the dog, human and mouse genome is very high. The majority of genes contain no sequence gaps, which is a great aid to scientists seeking to test particular genes as candidates for diseases.
Over the course of its evolution, the canine genome acquired more than two million SNPs, which are proving invaluable for understanding the role of genetic variation both within and between breeds. Such SNPs, analyzed using DNA chips or bead arrays, will be important for scientists conducting whole-genome association studies aimed at identifying genes that underlie complex traits in the dog. A dog chip with about 127,000 SNPs is currently available, allowing scientists to interrogate the dog genome at several thousand positions simultaneously. When the data from dogs with a given disease, for instance lymphoma, are compared to those from dogs without the disease, we can quickly pinpoint regions of the genome where disease genes are likely to lie.
Our research group, along with others, has been interested for several years in identifying genes that define the differences in body size, shape and appearance between breeds. Dog breeds vary not only in overall body size, but also in leg length, head shape and many other body features, all of which are controlled at least in part at the genetic level. The amount of morphologic variation observed in the dog is reported to surpass that of all living land mammals.
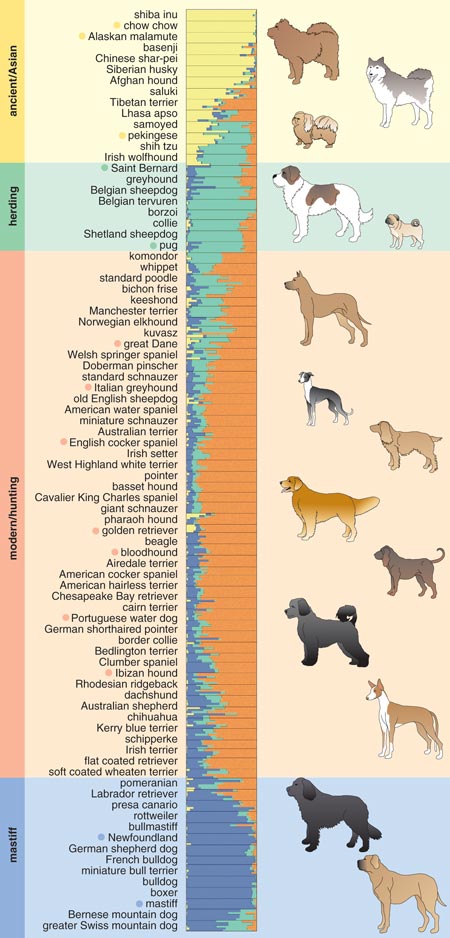
Figure 4. Based on patterns in the frequency of alleles (variations in the genome), the author’s group used a computer program to identify genetically distinct subpopulations within a group of 85 dog breeds. The breeds were divided into four groups based on the dominance of a particular cluster of alleles (vertical bar). The first group comprises dogs of Asian and African origin, thought to be older lineages (yellow). The second cluster contains herding dogs and sight hounds (green), whereas the third includes modern hunting dogs such as terriers, hounds and gun dogs (orange). The fourth cluster includes largely mastiff-type dogs with big, boxy heads and large, sturdy bodies (blue). Dots next to breed names correspond, from top to bottom, with breeds shown at right.
Adapted by Barbara Aulicino and Linda Huff from Parker et al. 2004.
The first important molecular study aimed at understanding the genetics of canine morphology was done at the University of Utah and led by Gordon Lark and Kevin Chase. The project, termed the Georgie Project in memory of a favored dog, focused on the Portuguese water dog, which is ideal for this type of study because it derives from a small number of founders, largely from two kennels, that came to the United States in the early 1950s. The breed standard permits a significant amount of variation in body size compared with other breeds. The community supporting the project is composed of highly motivated owners and breeders who have sought to improve the health of the breed through collaboration with scientists.
To date, the project has collected DNA from more than 1,000 dogs and has completed a genome-wide scan using more than 500 microsatellite markers on nearly 500 dogs. In addition to family history and medical data, more than 90 measurements have been collected for nearly 500 animals. These were derived from a set of five x-rays taken at the time of initial sample collection. Analysis of these metrics led to the development of four primary principal components (PCs), sets of correlated traits that define Portuguese water dog morphology. It is important to keep in mind that PCs are not genes but traits, and as such, they are susceptible to genetic analysis.
Analysis of the genome scan data and four PCs initially highlighted 44 putative quantitative trait loci (QTLs) on 22 chromosomes that are important for heritable skeletal phenotypes in the Portuguese water dog. QTLs derive from complicated statistical analysis and indicate locations in the genome that contribute coordinately to a particular trait. Of particular interest to us was a locus on canine chromosome 15 (CFA15) that showed a strong association with overall body size. Although this was only one of seven loci hypothesized to play a role in body size in the dog, we chose it as an initial focus because of the strength of the effect and the proximity to a compelling candidate gene.
To find the gene on CFA15, we searched for SNPs in a 15 million-base-pair region and then genotyped the resulting set of markers on all the Portuguese water dogs for which size information was available. The distribution of these markers displayed a single peak close to the insulin-like growth factor-1 gene (IGF1), which is known to influence body size in humans and mice. We investigated IGF1 in detail and showed that 96 percent of Portuguese water dog chromosomes carry one of just two patterns of alleles, which are termed haplotypes. The haplotype associated with small dogs was termed “B” and the one associated with large dogs “I.” Portuguese water dogs homozygous for haplotype B—that is, dogs that have the B pattern on both chromosomes—have the smallest median skeletal size, whereas dogs homozygous for I are largest. Dogs that are heterozygous—that is, those with a different pattern on each chromosome—fall between.
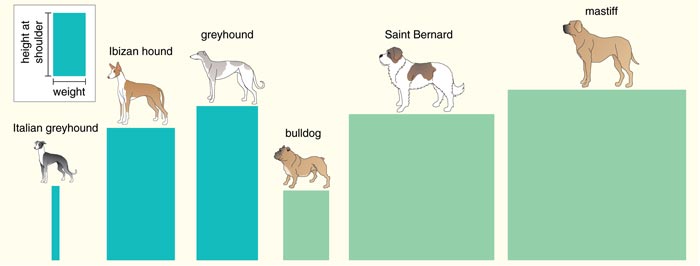
Figure 5. When characterizing a dog breed by its physical traits, one metric often used is the average height of the dog at the shoulder compared to the average weight of males of the breed. This ratio represents a trade-off between speed and strength: Dogs that have a higher height-to-weight ratio (blue) tend to have long, thin legs, whereas heavier dogs have thicker bones (green). This is one of the principal components, or sets of correlated traits, helpful in understanding the genetics controlling morphologic variation between dog breeds.
Adapted by Barbara Aulicino and Linda Huff from Parker and Ostrander 2005.
To study the presumably more general role of IGF1 in size differentiation among breeds, we surveyed genetic variation associated with 122 SNPs, spanning the relevant 34 million- to 49 million-base-pair interval of chromosome 15 in 353 dogs representing 14 small breeds and 9 giant breeds. Several lines of evidence pointed to IGF1 as the gene likely to account for small body size in the dogs.
Most notably, we observed a dramatic reduction in heterozygosity in small breeds over the IGF1 gene. These results demonstrate the presence of a selective sweep in this region, showing that IGF1 has been under tight selection by breeders seeking to create ever smaller dogs. In addition, the dominance of a single unique haplotype in our panel of many unrelated small dog breeds, together with its near absence in giant breeds, suggests that the mutation is ancient and likely evolved early in the history of domestic dogs.
The Georgie Project is remarkable for the number of putative loci that have been discovered by the initial analysis. In addition to loci for head shape, body size, leg length and a host of other traits, loci have also been described that reportedly control differences in size between the sexes, so-called sexual dimorphism. Sexual dimorphism is observed in almost all mammals including, of course, dogs. The mechanisms for maintaining sexual dimorphism are not well understood. It has been shown that the Sry locus on the Y chromosome plays an important role in sex determination and dimorphism, but this is clearly only a small part of the story.
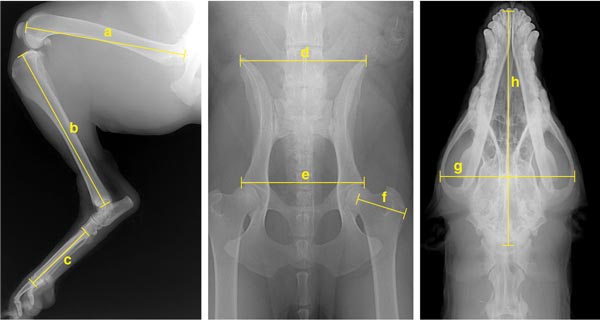
Figure 6. Portuguese water dogs were x-rayed to collect more than 90 physical measurements, which led to the development of four principal components that define the breed’s morphology. The areas measured included the hind limbs (left), pelvis (middle) and skull (right). Measurements included the lengths of the femur (a), tibia (b), foot (c) and skullbase (h), as well as the widths of the ilium (d), hip (e), trochanter (f) and skull (g). These measurements were used in a genetic analysis of size differences between male and female dogs (Figure 7).
Photographs courtesy of Kevin Chase.
The study of the Portuguese water dog has filled in some additional pieces of this interesting puzzle. This vignette has its roots in the original observation that a locus on chromosome 15, which may or may not be IGF1, interacts with other genes to make males larger and females smaller.
On average, female Portuguese water dogs are 15 percent smaller then males. Chase, Lark and their colleagues observed that in females, a particular haplotype is dominant for small body size. In males, a different set of variants (another unique haplotype) associated with large overall body size is dominant. The locus on CFA15 interacts with another locus on the X chromosome that is known to escape inactivation, meaning that both copies of the genes in this region are turned on (in most locations on the X, only one copy is active).
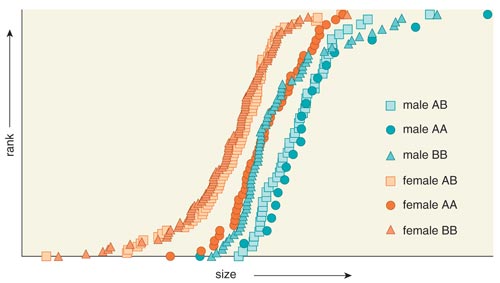
Figure 7. Like almost all mammals, Portuguese water dogs show sexual dimorphism—size differences between males and females. Analysis indicates that a locus on chromosome 15 interacts with another locus on the X chromosome to make males larger and females smaller. One haplotype or pattern of alleles (A) is dominant for males and is associated with large overall body size. A different haplotype (B) is dominant in females and associated with small body size. Following the rules of classical inheritance, homozygous (AA) males, or males with the A pattern on both sets of their chromosomes, are largest and BB females smallest. These data support an evolutionary hypothesis in which females become smaller as the result of natural selection for optimal size, through the inhibition of major genes that enhance growth.
Data courtesy of Kevin Chase. Adapted by Barbara Aulicino from Chase et al. 2005.
Females who are homozygous at the X-chromosome locus and who are also homozygous for the large-size CFA15 haplotype are, on average, as large as large males. However, all females that are heterozygous at the X-chromosome marker are small, regardless of their CFA15 genotype. This result suggests several scenarios for how genes interact to affect major complex traits, such as body size, and suggests a mechanism for the evolution of sexual dimorphism.
Two observations from the study must be accounted for in the development of any model to explain canine sexual dimorphism. The explanation must include a discussion of the reversal of dominant haplotypes between males and females associated with CFA15 locus as well as an explanation for the interaction between the CFA15 and X-chromosome loci.
To address the first question, Chase and his colleagues propose the existence of another sex-specific factor. For example, the CFA15 locus might contain two distinct genes associated with two haplotypes; the so-called Ahaplotype acts in both males and females to upregulate size, while the B haplotype and its associated allelesdo not upregulate size but rather contain another gene that suppresses the up-regulator.
The second phenomenon, heterozygote-specific interaction, could be explained by arguing that the activation of haplotype As critical upregulator gene requires interaction with a protein produced by the X chromosome.
The data of Chase, Lark and their colleagues are consistent with predictions made in the early 1980s that sexual dimorphism evolves because females secondarily become smaller than males as a result of naturalselection for optimal size. Reduction of female size relative to that of males takes place, according to this hypothesis, through an inhibition of major genes that enhance growth, such as the locus on CFA15.
Studies such as those described above are well designed for understanding complex or multigenic traits. But there remains some “low-hanging fruit” to be harvested in the study of canine morphology—other cases where apparently single genes contribute to major traits of interest. An example is provided by my research groups study of the whippet and a mutation in the gene coding for myostatin, a growth factor that limits the buildup of muscle tissue. In this study we found a new mutation in the myostatin gene, MSTN, and observed that it results in a double-muscled phenotype known as the “bully” whippet.
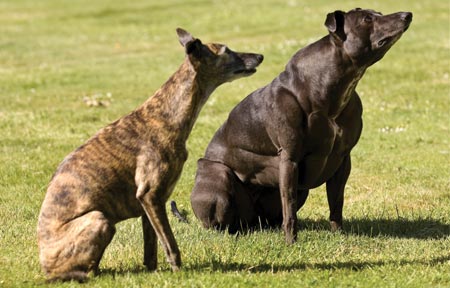
Figure 8. Whippets are usually sleek, trim dogs (left), but a variant called a “bully” is overly muscled (right). The author’s group found that a mutation in the gene that codes for myostatin, a growth factor that limits the buildup of muscle tissue, is responsible for the phenotype. Individuals that carry two copies of the mutation are “bullies,” but those dogs that carry only one copy are only somewhat more muscular and are also often faster racers.
Stuart Isett/Polaris
The typical whippet, a medium-sized sight hound, is similar in appearance to dogs of the greyhound breed and weighs about nine kilograms. Whippets are characterized by a slim build, long neck, small head and pointed snout. Bully whippets, however, have broad chests and an unusually well-developed leg and neck musculature that makes them unattractive to fanciers of the breed.
Using a candidate gene approach, we showed that individuals with the bully phenotype carry two copies of a two-base-pair deletion in the third exon (a gene region that is transcribed to make portions of proteins) of MSTN, with the result that a truncated or mutant protein is produced. These findings were somewhat expected, as the double-muscle phenotype observed in the whippet is reminiscent of what has been reported in mice, cattle and sheep